


Few and Different – Isolation Forest Algorithm
Article published in Big Data Magazine by Begoña Vega, Analytics Strategy Expert at Innova-tsn.
The dizzying digitisation we are experiencing, coupled with the technological advances of recent decades, have brought about a golden age of advanced analytics, thanks to the vast amount of data available and the technological support needed to apply certain algorithms in a more efficient way. In this context, the market increasingly requires more optimised and sensitive predictive models and solutions that not only offer the best possible prediction but are also operable and add tangible value to the business.
Despite the abundance of data from many sources, what happens when the events to be predicted do not occur frequently? Is it possible to provide an adjusted and reliable prediction? At Innova-tsn we recently approached a problem like this: the customer’s business objective was to optimise the merchandise replenishment processes of several shops with thousands of references. To do this, we had to address a sales forecast, consider the stock and decide how to provide for that supply, with the added difficulty that most of the references were from sporadic sales. How to arrive at a solution that offers sufficient accuracy, at reference level, to make the result operable?

This article presents the conclusions of real analysis, in which we studied the different alternatives for approaching the problem and evaluated the benefits and limitations of their implementation.
In these situations, the aim is to predict whether an event (in this case the sale of the reference considered in each case) is going to occur or not, so it is usual to train supervised binary classification models. To do this, we train the model with a history of data in which we observe, for different times and conditions, whether or not the event finally occurred. The choice of algorithm depends on the volume of records and the type of prediction variables. The most common algorithms when faced with a large volume of data are Logistic Regression, Support Vector Machines, K-Nearest Neighbours, and ensembles, which usually give better results, such as Random Forest, AdaBoost, Gradient Boosting, etc.
In our case, moreover, we had particular examples for some of the references: we found cases of very sporadic sales, in which, according to the history, the probability of occurrence of the event (the sale) was very low (0.15%).
When the probability of the event is so low, prediction becomes more complex, you have fewer occurrences in the available history and modelling is challenging. In our case, the very low conversion rate allowed us to think about the possibility of another approach, where I treat the conversion as an anomaly in a set where “normal” is that nothing happens (that the sale does not occur).
So what is an anomaly? D.M. Hawkins defined anomalies in his book Identification of Outliers [1] as “an observation that deviates so much from other observations as to arouse suspicion that it was generated by a different mechanism”.
Thus, anomalies are very infrequent occurrences that tend to have different behaviour or patterns from the rest. Finding these patterns in the data is precisely the task of anomaly detection algorithms, which are also considered unsupervised since it is not usual to identify outliers a priori.
One of the most commonly used algorithms for this task is the Isolation Forest [2], inspired by the Random Forest classification algorithm: The model consists of combinations of multiple trees, which are generated recursively by creating branches, until each observation is isolated at a terminal node.
In contrast to the Random Forest, which is supervised, in the Isolation Forest, the selection of the splitting points of each branch is done randomly. Thus, those observations with different characteristics from the rest will be isolated in a few steps.
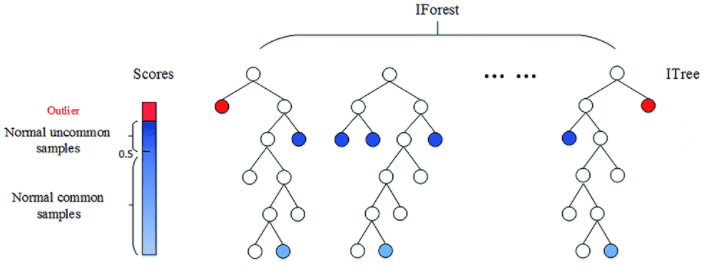
This algorithm attributes to each observation a score that is calculated as the average of the number of subdivisions that have been necessary to isolate that observation in the set of values. The lower this value, the higher the probability that it is an anomaly. Consequently, those observations with the lowest score will be the outliers, thus the challenge is to find the appropriate cut-off point to determine which observations are considered outliers (Fig. 2).

Isolation Forest is considered the “Best in class” among anomaly detection algorithms. Its good reputation is justified: its logic is simple, convergence is achieved relatively quickly and it scales very well, with its complexity growing linearly with the number of records.
Also, in our case, we know the outcome of the classification. This means that we know whether the event finally occurred, so it is relatively easy to validate the result and establish a cut-off point for the classification. This cut-off point, which is known as the contamination parameter, is usually set as the probability value of the event. We did so in our case, leaving it at 0.15%.
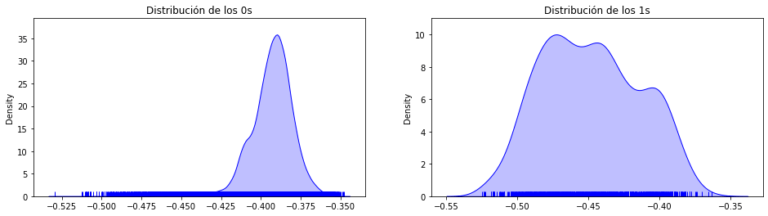
Therefore, in our research, we trained several Isolation Forest models with different parameters with the typical cases as training sample, leaving as validation set the one in which there were both typical values and outliers (0’s and 1’s).
On the other hand, we also trained several supervised models with different configurations, and finally, we compared the performance metrics of Iforest with those of the supervised algorithms whose configurations had given us the best results.
In our case, Iforest’s performance metrics were very close to those of the best supervised algorithms, although slightly below. Let’s not forget that supervised algorithms have the “advantage” of knowing the classification in advance and at each iteration they are looking for ways to improve the percentage of correct classifications, while Isolation Forest simply splits randomly without a classification goal.
Specifically, the AUC achieved by Iforest for the test set was 92.1% compared to 96.6% for Random Forest and 96.3% for LogisticRegression. (Fig.4)
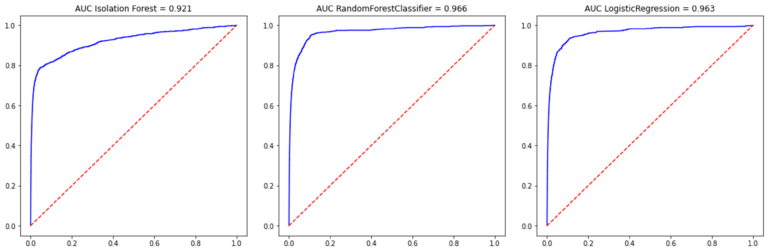
Consequently, we find that the results of IForest, without being as good as those achieved with the supervised algorithms, are frankly satisfactory.
Where do we see that this algorithm could be interesting to apply to?
In particular, we find the application of this type of algorithm very interesting in cases of electricity fraud, where the rate of fraud is very low, but it is not possible to have these cases of fraud labelled due to the high cost of inspecting each of the supply points. Being able to provide a reduced list of suspicious points identified with this algorithm makes it possible to detect a high volume of fraud while significantly reducing the cost. The fact of applying IForest, which is an unsupervised algorithm, means that it is not necessary to have a history of cases classified as fraud.
The same applies to any fraud identification problem (financial, at the POS of large chain shops, at insurance companies, etc.) where the identification of a short list of suspicious profiles is vital for the detection of potential fraud.
Other areas of possible use of this algorithm are industry and cybersecurity. In the first case, industry, anomaly detection could indicate when machinery maintenance is needed, saving costs on unnecessary maintenance and avoiding major damage by anticipating the breakdown. In the field of cybersecurity, it can be applied with detecting network intrusions through surveillance and identification of anomalous activity.
As we can see, the fields of application are numerous and varied, which is why from the area of Advanced Analytics, we are committed to addressing this line of work in future projects. Thanks to this, together with the integration of predictive systems in the solutions, placing the customer at the centre of the strategy, Innova-tsn manages to offer a complete integral system.
References
[1] Hawkins, D. M. (1980). Identification of outliers. London [u.a.]: Chapman and Hall. ISBN: 041221900X
[2] F. T. Liu, K. M. Ting and Z. Zhou, «Isolation Forest,» 2008 Eighth IEEE International Conference on Data Mining, 2008, pp. 413-422, doi: 10.1109/ICDM.2008.17.