


Innova-tsn has participated in #HACKINSAS 2021, the Hackathon organised by SAS
A first-hand account of the solution
In the current complex situation that has arisen as a result of the pandemic, Innova-tsn embarked on the hackin SAS Hackathon 2021, with a team formed by Jose Ignacio Bernaldo and Jesús Adolfo Cariño, named “Innova Tracers.”
With this competition and through innovation, creativity and advanced analytics, our team wanted to help fight against Covid-19, reducing virus infections with the solution: “COVID MONITORING SYSTEM.”
The final goal of the project developed for the SAS Hackathon 2021 was to improve the safety of each and every one of us, reducing the possibilities of infection and, particularly, increasing the safety level of indoor spaces.
For this purpose, this solution was proposed, “Covid Monitoring System.” It uses the most advanced data analysis technology to monitor the conditions of indoor spaces in real time, calculating variables related to room conditions and individual and collective risk indicators by means of predictive techniques.
COVID MONITORING SYSTEM
When dealing with the development of this project, one of the first aspects on the table was what data and how and where to gather the necessary data for the hackin SAS 2021.
On one hand, we thought of variables such as room conditions, which could be collected by using devices installed in the different premises: CO2 level meters, noise level meters and even images taken with cameras.
On the other hand, we opted for individual risk indicators related to people’s lifestyles: number of visits, time spent in the place, distance with the rest of people in the premises, correct use of the facemask… In short, the richness and value of this data depended on the information people wanted to contribute.
For this purpose, two functioning levels were suggested: one based on non-personal identification, focused on an identification of the mobile device and another based on the user’s registration, which would allow each individual to provide the data they may consider appropriate and receive notifications and information about the system.
In this context, with the identification of people in the indoor spaces through WI-FI receivers, the variables of capacity and proximity could be calculated with non-intrusive techniques. These variables, together with room conditions, allowed us to monitor the different premises and set preliminary risk levels.
In a second phase of this hackin SAS, by gathering past information on people’s behaviour, their visits to indoor spaces and social interactions inside them, predictive techniques could be used to calculate an individual risk level which took into account a mobile time window (for instance, 2 weeks).
Lastly, by gathering all the calculated variables, it was possible to forecast a risk level in the premises, which allowed more accurate monitoring and decision-making adjusted to the current situation, taking into consideration the conditions and the people present there at the time.
Metodology of the project fo hackin SAS 2021
The methodology used during this hackin SAS 2021 consisted of three phases.
Initially, the system gathered information from multiple devices and different sources to create a set of important variables in order to estimate a preliminary individual infection risk per individual. Once enough historical data had been collected, we entered the second phase, where a collective risk was estimated according to the interactions with other users.
Finally, an individual’s infection risk was estimated, combining the information from the preliminary individual risk and the collective risk in the past two weeks with the interactions said individual was having at that time and the safety measures of the place he/she was in.
Phase 1: Collection of Information
The first phase was divided into three parts accordingly: valuable data collection, calculation of variables and the calculation of the preliminary individual risk.
As for input data, information from different sources could be included, which allowed us to discover: the individual’s location and distance between people, surveys on lifestyles, the premises’ conditions, air quality, the room’s capacity for ventilation…
Specifically, in this development of an initial prototype, some of the sources below were selected:
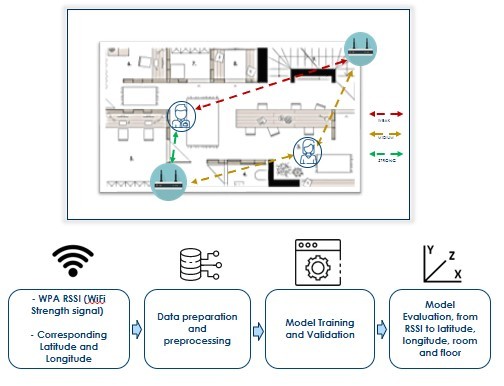
- In order to obtain the positioning and monitoring in indoor spaces, we used a non-invasive method which did not require specific hardware for its implementation, so we used the WIFI signal strength of the premises’ routers to identify the latitude and longitude of an individual, as well as their physical location (floor and building), provided the network belonged to the same customer.
- To convert the WIFI strength signal of each user ID connected to the latitude-longitude, an automated learning model was used. This model was trained using the relation between signal and location. It was implemented in SAS Viya where several models competed with each other, including a linear regression, neural networks, random forest and gradient boosting.
- For the limits and restrictions of the room, we used the local laws on indoor air quality limits and the maximum capacity of people in the room.
- As for air quality in the room, we used an IoT device with different sensors to gather key information such as, for example, CO2 concentration.
- As for the survey, it was sent to each user and general information about their lifestyles was requested. Thus, we obtained information about the risks an individual was exposed to, for example, do you go to your office for work? How often? Do you go there by public transport? etc.
Once all this information was gathered, despite not having yet a history, a set of variables calculated for each individual was extracted; for example, if the capacity of the room was exceeded while the individual was there or if safety distance was respected or if CO2 concentration in the premises was above the regulations, thus meaning poor ventilation, and so on. Big data & Advanced Analytics tools and methodology have been used to achieve this.
To conclude this phase of hackin SAS, a preliminary individual risk was estimated with this set of variables calculated for each individual. This was calculated by using a weighted sum whose weights were selected according to studies, surveys, and expert criteria, so to identify what alarms may entail a higher risk of infection. The output was normalised and categorised and we obtained a three-degree individual risk: high, medium or low.
Phase 2: Collective Risk
Once enough historical data was gathered, this phase could start. It also consisted of three parts: interaction data acquisition, calculation of the set of variables and calculation of the interaction risk.
In this case, data input consisted of the processing of the historical information about the location of each individual inside an establishment so to infer the interactions every individual had with other users. This information was combined with the preliminary individual risk for every individual so to extract variables in conjunction with the linked risk, such as: How many high-risk people have you interacted with in the past two weeks?
Finally, interaction risk was estimated based on these high-risk or medium-risk interactions between users during the set risk time.
Phase 3: Risk by individual
The aim of this last phase was to estimate an infection risk for every individual based on all the information obtained previously.
In order to calculate the infection risk, we used the preliminary individual risk and the interaction risk with the information available from the past two weeks and we combined it with the user’s current interactions at the moment and the current safety conditions of the place the user was in.
All this information was processed and combined by means of a weighted sum and it was then normalised and categorised to obtain a three-level infection risk for every individual: high, medium or low.
Visualisation:
In order to present and visualise the results, a Dashboard was developed where the information from the results of each phase was shown, including: the different risks calculated, the state of the room, the list of interactions and the indoor location of active users with their linked individual risk.
To build the Dashboard and implement the different risks, a combination of Python and SAS Viya was used: some parts were independently developed in Python, such as the processing of some variables, and other parts were developed by integrating SAS VIYA with Python, such as the creation and competition of models. Lastly, the final development of the Dashboard was specifically developed in SAS Viya.
The architecture of the proposed system made use of SAS’s capacities, which allowed us to design data batch exploitation strategies in real time and in a scalable manner, so new data sources can be added progressively to improve the quality of the predictions.
Among the multiple actual and practical applications the implementation of this solution may have, there is helping control the capacity of business premises –restaurants, offices and, in general, any indoor space– so to design and study the effectiveness of different safety strategies. This allows us to know what risk situation we are in at any given moment.
With all this information, methodically presented in real time, it was possible to make data-based decisions to prevent possible infections, which led us to a safer environment and to contribute to restart the economy in a sustainable way, answering the question this hackin SAS proposed.